Risk Analysis
Who is the guidance for?
This guidance on Risk Analysis in the Community Risk Management Plans (CRMP) process is for those tasked with leading and managing and developing the CRMP for UK Fire and Rescue Services (FRS). According to the CRMP Fire Standard, Fire and Rescue Services must:
“Analyse risk, consider its risk appetite, determine the risk levels and prioritise risk accordingly.”
In 2020, the NFCC’s Community Risk Programme (CRP) through its Definition of Risk (DOR) project, delivered a national definition of risk, a Glossary of Risk-Related Terms and a conceptual risk framework for the UK Fire and Rescue Service, to help bring national and local consistency to community risk management planning.
The whole CRMP is underpinned by three key themes that should support, influence, and inform each individual component throughout the whole process:
These themes should be utilised to ensure each component within the process has been developed using a broad range of community and organisational intelligence, and links are made throughout this guidance.
Individuals within an FRS who work to develop a CRMP may differ between fire services and may differ from one cycle of CRM planning work to the next. With these acknowledgements in mind, a series of Competency Frameworks have been developed with the aim of clearly articulating the requisite competencies (behaviours, skills, knowledge, experience, and techniques) required to develop a CRMP. Within the competency frameworks, the requisites are outlined for strategic level staff, as well as risk analysis and implementation level staff.
“We encourage all practitioners involved in risk management to have a good awareness of the limitations of their risk management methodologies, as this will influence the relative validity of findings, and push FRSs to continue to improve their methodologies” (National Review of Community Risk Methodology across the UK Fire and Rescue Service)
Overview
Risk Analysis is the element of the CRMP process where the risk level of an identified hazard or hazardous event is determined.
The sources and causes of the hazardous events generated during hazard identification should be considered, together with their consequences, and the Likelihood of those consequences occurring.
This involves developing an understanding of each hazardous event, including the effectiveness of current risk mitigation and risk reduction activities This will generate the ‘risk level’. This should be compared with the risk criteria defined as part of CRMP scope, to identify whether additional mitigation and reduction activities are needed.
The risk assessment will inform priorities for improvements to, and/or adjustments to, mitigation and reduction activities and the associated deployment of resources. The decisions should take account of the scope, and the actual and perceived consequences to external and internal stakeholders.
It depends how the individual CRMP is structured and within what framework it operates, on how best to group risks during analysis, e.g. London Fire Brigade breaks its operational risk into five categories: people risk, process risk, systems risk, external events risk, and legal and compliance risk.
The risk assessment should comprise an appreciation of the following:
-
The sources and causes that lead to the hazardous events.
-
The consequences that could occur (expressed in terms of the objectives), along with their nature and magnitude.
-
The associated Likelihood of those consequences occurring.
-
The effectiveness of the mitigation and reduction activities that are already in place.
-
The overall risk level once the nature of the hazardous events and their potential impacts are measured against the effectiveness of mitigation and reduction activities already in place or proposed mitigation and reduction activities.
-
Where further resources could be directed, and for what effect
-
Uncertainty in any of the above.
It is essential to consult the dedicated guidance on handling Data and Business Intelligence prior to undertaking Risk Analysis. While this entire document is intended to be used a key reference point, particularly relevant is the section on Analysing and Visualising data, for the insights within on how data is to be interpreted and packaged to inform decision-making.
Likelihood
Likelihood is defined as the calculated probability and frequency of a hazardous event occurring and the consequences accruing from the event. This includes determining the influence of causal factors and how existing organisational mitigation and reduction activities will have on the overall Likelihood.
In the absence of complete data, Likelihood might in part involve an expression of informed beliefs based on lived experience or horizon scanning for similar risks elsewhere, available data, or other information. Likelihood can be estimated by either using:
-
Historical data based on similar events that have occurred (note this can only be used if there is sufficient historical data for the analysis to be statistically valid).
-
Informed judgement of subject matter experts.
A risk likelihood matrix can be used to define assessments of likelihood, such as the one below (table 1)
|
|
Likelihood |
Probability |
Approximate Frequency |
Description |
|
5 |
Very High |
>90% |
Occurs at least once every 5 years |
Is a common occurrence |
|
4 |
High |
51-90% |
Occurs between ever 5-10 years |
Has occurred in many times |
|
3 |
Medium |
26-50% |
Occurs between ever 10-20 years |
Has occurred in on several occasions |
|
2 |
Low |
11-50% |
Occurs between ever 20-50 years |
Has occurred on a small number of occasions |
|
1 |
Very Low |
<10% |
Occurs less than every 50 |
Has occurred once/never |
Table 1: Risk Likelihood Matrix
It helps to consider the factors associated with the Likelihood of a hazardous event occurring. This needs to be informed by the CRMP Equality Impact Assessment.
For example, the infographic below, which was produced as part of the DoR project, outlines a range of factors that appear to statistically correlate with increased likelihood of dwelling fire. This does not include individual health and behavioural factors such as smoking.
It is worth noting that the Likelihood of ‘Other Building Fires’ as developed in the DoR methodology, is purely an estimated ‘rate of fires’ per year against building types.
Consequences
Consequence may be defined by asking the question, “What is the severity and extent of the harm that will be potentially caused by a hazardous event?”
This determines the impact that existing organisational mitigation and reduction activities will have on the overall consequences.
Hazardous events lead to either a specific consequence, or to a range of consequences of different types and magnitude.
Determining the type and levels of magnitude of consequences requires collecting, collating, and considering relevant available data and evidence. Techniques to determine the types and magnitude of consequences might include the following:
-
Review of past events. It is important to consider that past data may not be indicative of the full range of consequences that are possible. Data quality issues may impact historical data – consult Data and Business Intelligence Guidance ‘Prepare and Organise’ section for guidance on data preparation, cleaning, and quality assurance. Also, data is by its character, a report of history and therefore must be balanced with lived experience and updated local knowledge.
-
Modelling, to determine the way in which consequences may develop during and following an event, given the various key risk influencing factors
-
Consideration of both immediate and secondary consequences, such as those affecting associated systems, activities, equipment, or people. For example, a serious fire (or flood) in a hospital hitting out a ward/operating theatre etc., may have knock-on consequences for ambulance waiting times, operations being delayed, funding being diverted from care, more deaths, greater levels of illness and delays in treatment, and other impacts.
Risk Metrics
A risk metric is a way of measuring the risk level to assist with subsequent relative weighting and response prioritisation.
Risk metrics include many ways of combining the likelihood and consequence elements of risk. As risk is a multidimensional concept, there are many different possible risk metrics.
-
Event frequency – the number of hazardous events of a specific type (meaning that there is more than a specific consequence threshold) in a specific time period. For example, the fire frequency could be the average annual number of fire callouts in a specific FRS area.
-
Expectation value – the event frequency multiplied by the event consequence. For example, a fire damage rate could be the average annual cost of damage from fires in the UK.
-
Risk matrix – a plot showing the likelihood and consequence of different events, grouped by typically 3-5 likelihood and consequence categories which are then multiplied against each other or otherwise combined in a way that attempts to account for both factors.
-
Probability distribution – a distribution showing the likelihood of different consequences of event. For example, the probabilities of different numbers of fatalities, given fires in the UK.
-
Exceedance distribution – a distribution showing the likelihood of exceeding different consequences of event. For example, the frequency-fatality (FN) distribution showing the frequency exceeding different numbers of fatalities in fires in the UK.
-
Risk contours – lines joining locations exposed to the same risk. For example, contours showing the probability of explosion damage around a chemical plant.
In considering risk metrics on frequency there is an excellent presentation produced by the Risk Engineering organisation that illustrates some of the challenges.
In developing a risk matrix, it is essential that the categories such as High, Low, and Medium are clearly defined as to what thresholds these refer to. This will vary according to the Service region’s definitions but the originally defined definitions should be sense-checked with Watch Commanders, Station Managers and others who can add lived experience to the definition.
This diversity explains why the expectation value is too specific to be a general definition of risk. Risk metrics should cover all relevant risk groups.
For example, they may refer to:
-
Injury or fatality risks for people.
-
Damage probabilities or costs for properties.
-
Business interruption costs.
-
Impacts on the environment.
Risk metrics may refer to:
-
Group risk – the total risk in a specific group. For example, the average number of injuries in a specific FRS or the annual cost of damage from fires in the UK are both types of group risk.
-
Individual risk – the average risk for individuals within a specific group. For example, the individual risk for a fire-fighter may be expressed as the number of deaths per fire attended, per person-year or per 100 million hours.
Risk metrics may be expressed as:
-
Absolute risk – metrics that directly quantify the risk, comparable to accident statistics. For example, the annual probability of death.
-
Relative risk – metrics that are proportionate to the risk but not comparable to accident statistics.
In general, is it harder to draw conclusions about consequence that it is likelihood. While ‘likelihood’ assesses the relationship between potential factors that could lead to a hazardous event, ‘consequence’ estimates a measure of the severity of the incident.
As part of the DOR project, the NFCC propose an overall consequence score can be calculated by determining the consequence score for both life and property using the table below:
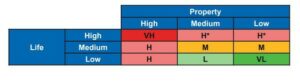 Table 2: Risk Matrix for Consequence
Appendix 1
Examples in Practice
Nottinghamshire Fire and Rescue – Community Risk Review and Assessment of Risk
Nottinghamshire Fire and Rescue Service worked with ORH to provide independent support to develop an evidence base to support strategic decision-making using a LSOA Level Assessment. The resulting report summarises:
-
ORH worked with NFRS to identify the incident categories that NFRS must plan for, taking account of differences in the frequency, location and consequence of incidents.
-
For each category, ORH sought to identify the likelihood of an incident occurring by LSOA in Nottinghamshire through analysis and modelling. This was based on a wide range of suitable data sources where there may be a link to the likelihood of incidents. ORH created a database of all LSOAs in Nottinghamshire, populated with the historical incident data and using all potential data sources, and this built an extensive profile of every LSOA.
-
ORH applied Random Forest modelling and statistical analysis to identify which factors were good indicators for the likelihood of each of the different risk categories. The outputs from this work included:
-
Ranked list of contributory factors to likelihood of incidents
-
A database of LSOA risk for each incident category.
Appendix 2
Domestic Dwelling Fires Risk Methodology
The following is the executive summary from the Domestic Fires Risk Methodology Report
This report provides two data-led approaches, one using LSOA data modelling and the other using UPRN data modelling to ensure that all services are able to apply the methodology locally whilst still achieving consistency nationally.
Some of the key factors linked to likelihood of dwelling fires include car or home ownership, (un)employment, deprivation, property type and tenure. Similar factors are associated with consequence; however these differ for life and property consequences, and neither provide the robust predictions as for likelihood. Individually, the correlated factors that have been identified do not necessarily contribute to higher risk, however, when considered collectively, these factors can be used to identify areas that are statistically more likely to contain people who are higher risk (January 2022).
The approach involved collecting incident data from the Incident Recording System (IRS) and national data on a wide range of potential influencing factors. The consulting organisation developing the methodology, ORH, used data analysis and statistical modelling to assess these factors and develop a long list of associated factors. From this, the focus shifted to producing a framework methodology that any fire and rescue service could apply in its local area.
The key recommendation is that FRSs follows the Unique Property Reference Number (UPRN) model to evaluate likelihood and consequence. However, it is recognised that some FRSs will be more comfortable working at the Lower Layer Super Output Area (LSOA) level, so this methodology is also provided.
Appendix 3
Risk Analysis Competencies
The Competency Framework for CRMP articulates the requisite competencies (behaviours, skills, knowledge, experience, and techniques) required to undertake CRM planning.
Within the competency frameworks the following requisites are outlined for strategic level staff members, as well as risk analysis and implementation level staff members for risk analysis:
Strategic level (FRA members, PFCC, CFO, Chief Fire Officer team)
-
Adept at understanding and scrutinising risk analysis methodologies.
-
Confident to challenge and examine interpretations of risk analysis findings effectively.
-
Strongly focused, keeping priorities in clear view, and not becoming preoccupied by other, non-priority matters.
Strategic level (Risk analysis and implementation level)
-
Knowledgeable and up-to-date ability to evaluate and select appropriate risk analysis methodologies based on nationally benchmarked risks, and implement these at a local level to inform the community risk management planning processes effectively.
-
Ability to interpret and use past performance and incident data across all operational areas to inform trends and changing/emerging risks.
-
Fully skilled at developing and managing technological and digital solutions to handle and support the community risk management planning processes effectively and efficiently.
-
Good understanding (or access to those who have a detailed understanding) of Prevention, Protection and Response (including National Resilience) activities and capabilities and how these can directly influence the community risk management planning processes and the level of risk within local communities.
-
Fully skilled at developing and managing robust governance processes linked to data mining and storage; community risk management plan risk recording; and decision logging to make sure that all elements can be evidenced, justified, and scrutinised effectively.
-
Ability to interpret and use past performance and incident data across all operational areas to inform clear understanding of trends and changing/emerging risks
As highlighted within the competency frameworks, most FRSs will have strategic leads for different areas of business, for example: Equality and Diversity, ICT, Data and Business Intelligence, and Partnership Working, etc.
Where there is no existing provision for this strategic leader role in the FRS’s community risk management planning process, or access to a senior leader from elsewhere, it may be useful for the FRS to consider how best to ensure there is appropriate direction and accountability.